The following Monday morning found Alpine’s conference room transformed into a control center for software implementation. Stefan and Andrea from ScheduleMate Solutions had arrived with laptops and what looked like enough documentation to fill a small library. Emma, Sarah, Klaus, Patrick, and Otto gathered around the table, with Marcus and Henning joining via video.
“Welcome to day one of your scheduling transformation,” Stefan began enthusiastically, pulling up a polished presentation. “We have a proven implementation methodology that we’ve refined over dozens of deployments. Let me walk you through our approach.”
He clicked on a Gantt chart showing phases, milestones, and deliverables. “Phase one is discovery and configuration—two weeks. Phase two is data validation and testing—three weeks. Phase three is training and pilot—two weeks. Phase four is go-live and stabilization—two weeks. That puts us at roughly nine weeks from today to full implementation.”
Sarah studied the timeline, then raised her hand. “Before we dive into how we’ll implement, can I ask a more fundamental question?”
“Of course,” Stefan said.
“How will we actually know if this implementation is successful?”
The room went quiet. Stefan’s presentation paused on a slide about data migration strategies.
“I mean,” Sarah continued, “Emma said at contract signing that we expect to use the system for daily scheduling within three months, improve on-time delivery within six months, and reduce overtime costs within nine months. But what does that actually mean? How do we measure those things? What numbers prove we’ve succeeded?”
The Measurement Challenge
Andrea nodded approvingly. “That’s exactly the right question, Sarah. Too many companies focus only on implementing the software without defining success criteria upfront.”
She pulled up a different presentation. “Let me show you our standard dashboard with scheduling KPIs that we typically help customers implement alongside the scheduling software.”
The screen filled with colorful charts and metrics: Schedule Adherence Rate, Average Lead Time, Resource Utilization, On-Time Delivery Performance, Work-in-Process Inventory, and Throughput Rate.
“These are the standard metrics we track,” Andrea explained. “The scheduling software generates most of these automatically based on your planned versus actual performance.”
Klaus leaned forward. “How do you measure ‘actual performance’? I understand planned—that’s what the schedule says should happen. To determine this, we will use the data from Business Central before we start posting to the production order. Namely, ‘planned’ is the information from the production order routing line and the production order component list. In contrast to this, ‘actual’ requires knowing what really happened on the shop floor.”
“Exactly,” Stefan said. “The system needs production data—when operations actually started and finished, which resources were used, how long things really took, and which material you precisely consumed for the production orders. That data should be found in your Business Central capacity ledger entries and item ledger entries.”
Patrick had been quiet, but now he shifted uncomfortably in his seat. “Can I clarify something about how we are using Business Central today?”
“Please,” Stefan said.
“We decided on a simple and pragmatic approach,” Patrick explained. “When a production order finishes completely, we post the output and consumption. We don’t track individual operations. We don’t report start and finish times for each production order routing line. We just report when the entire order is done. This has been sufficient for all our processes so far. And it is very efficient.”
Stefan’s expression changed subtly. “So, you don’t have operation-level data?”
“Correct,” Patrick confirmed. “We made that decision deliberately during our Business Central implementation. We just post the entire production order as finished via the Production Journal. When we do this, we quickly check the consumed parts. However, we never make any time-related entries. Once this is done, we change the production order status to finished. This makes things simpler for the shop floor. Operation-level posting would have added complexity we weren’t ready for.”
Andrea and Stefan exchanged glances. “That’s going to affect what we can measure,” Andrea said carefully.
The Data Infrastructure Gap
Sarah felt something cold settling in her stomach. “Walk me through this. What measurements require operation-level data versus what we can measure with order-level data?”
Stefan pulled up a technical diagram. “With order-level posting, you know when an entire production order finished and is reported complete. You can measure whether the complete order is shipped on time to the customer. You can calculate overall throughput—orders started versus orders completed.”
“But?” Sarah prompted.
“But you can’t measure schedule adherence at the operation level,” Stefan explained. “You don’t know if the first operation started when scheduled, or if it finished on time before moving to the next operation. You don’t know whether delays occurred in precision machining, or assembly, or finishing. You don’t know if actual operation times matched your routing estimates.”
He clicked to another slide. “Most importantly, you don’t have real-time visibility into where jobs currently are. The schedule shows where they should be, but you don’t know where they actually are until someone reports the entire order complete.”
Klaus was taking notes rapidly. “So, we can measure output-level, such as on-time delivery—did complete orders ship when promised. But we can’t measure whether individual operations met their scheduled times?”
“Correct,” Stefan confirmed.
“And we can’t see work-in-process status in real-time?”
“Not without operation-level reporting.”
“And we can’t compare actual versus planned times to improve our routing estimates?”
“Not systematically, no.”
The room fell silent as everyone processed the implications.
The Operation-Level Debate
Klaus broke the silence. “Then we need to implement operation-level posting. Those measurements are critical. We can’t manage what we can’t measure.”
Otto shook his head immediately. “Hold on. Let’s think about what that means on the shop floor.”
“It means better data,” Klaus said.
“It means every operator stops at every workstation to report times,” Otto countered. “Schmidt finishes a precision machining operation, he goes to a computer or tablet, logs in, finds his production order, reports the operation complete, and enters actual times. Then he moves to set up for the next job. That’s five to ten minutes of administrative work added to every operation.”
“That’s the cost of accurate data,” Klaus argued.
“Multiply five minutes by twenty operations per day per machine times six machines,” Otto calculated. “That’s ten hours of productive time converted to data entry. Every single day.”
Patrick added, “And we’d need tablets or terminals at every workstation. Our current shop-floor computers are 50 meters apart. Operators would spend more time walking to terminals than entering data.”
“Plus,” Otto continued, “my team isn’t used to that level of digital discipline. Right now, they focus on making good parts. You want them to focus on making good parts, entering data accurately, and timing themselves precisely. That’s a significant cultural change.”
Klaus looked frustrated. “But without that data, we’re flying blind. How do we improve if we don’t know what’s actually happening?”
“We’re not flying completely blind,” Otto replied. “We know when orders finish. We know when they ship. That’s not perfect visibility, but it’s not nothing.”
The Reality Check
Stefan had been listening to the debate with growing concern. Finally, he held up his hand.
“Can we pause this discussion for a moment? I think we’re debating a dream world rather than dealing with reality.” He looked around the table. “May I ask you something practical? How do you currently update your whiteboard when things go unplanned on the shop floor?”
The question hung in the air. Sarah and Otto exchanged glances.
“What do you mean?” Sarah asked.
“I mean, right now, today, when there are serious issues in running an operation, or a machine breaks down, or materials don’t arrive—how do you know to update your whiteboard? You don’t have operation-level posting. You don’t have shop floor terminals. So how does information flow from the reality on the shop floor to the schedule on your whiteboard?”
Sarah thought about her typical day. “Otto calls me. Or he stops by my office. Or I walk to the shop floor, and he tells me what’s happening.”
“How often?” Stefan asked.
“Multiple times per day,” Sarah admitted. “If something significant changes, Otto lets me know.”
Stefan turned to Otto. “And how do you know what’s significant enough to tell Sarah?”
Otto considered this. “If a job that was supposed to start this morning hasn’t started by midday, I tell her. If an operation that should have finished today is going to run into tomorrow, I tell her. If we have a quality issue that’s going to delay something, I tell her.”
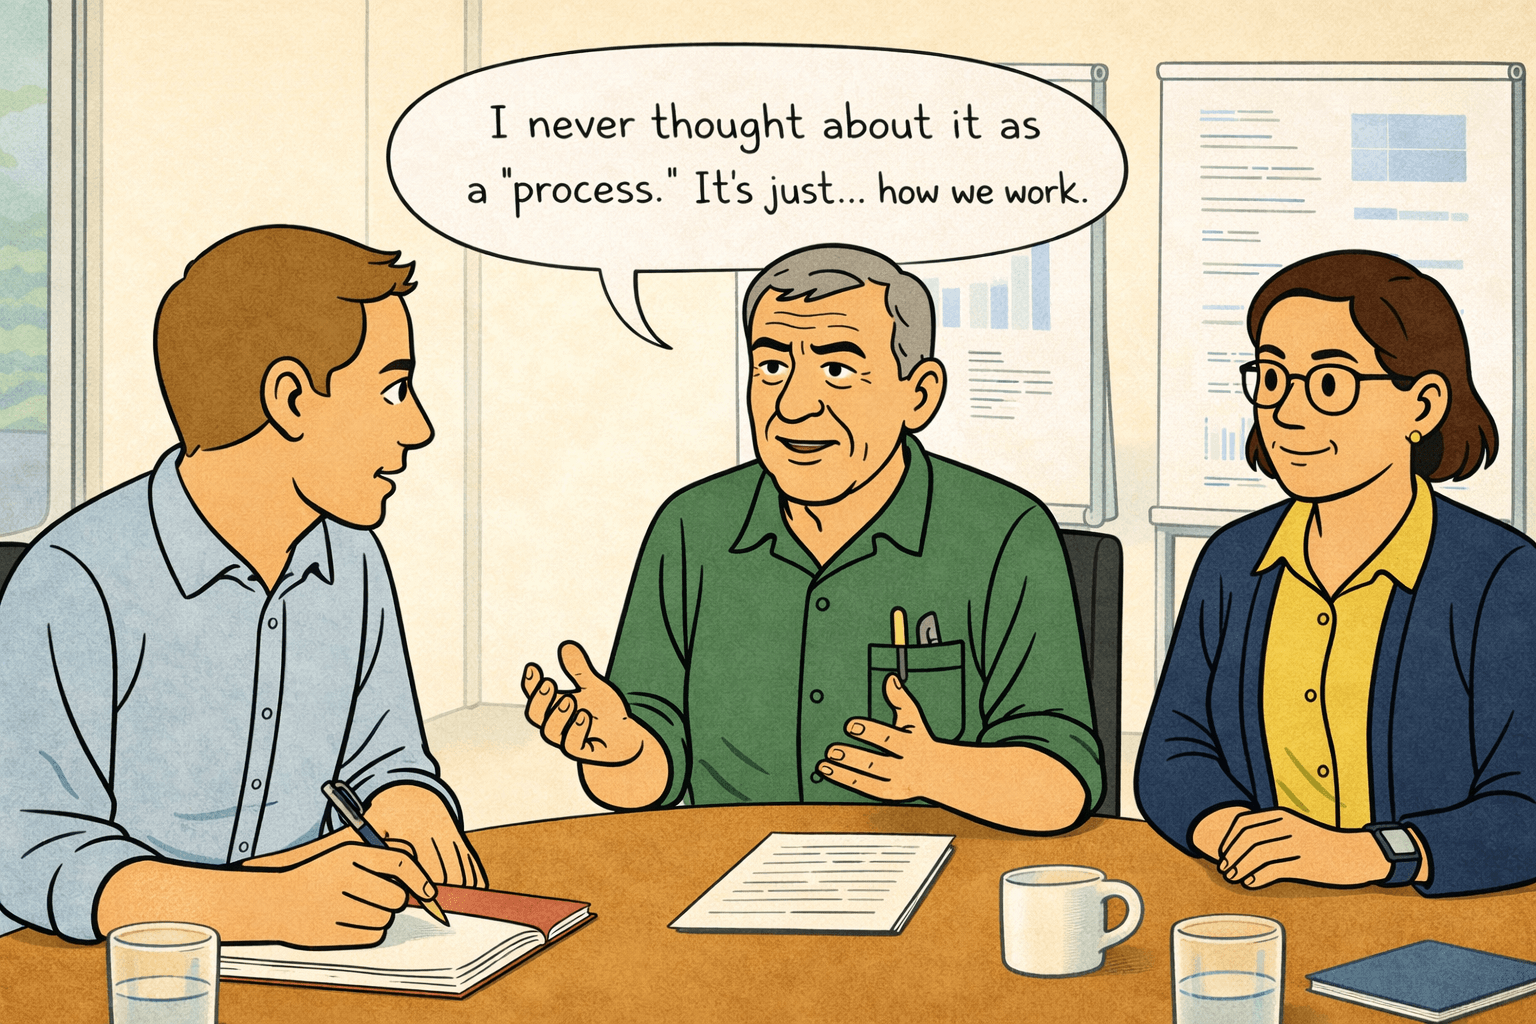
“So, you have an informal communication process,” Stefan said. “It’s not documented anywhere, not automated, but it works because you two talk regularly and you both understand what information matters.”
“I guess so,” Otto said. “I never thought about it as a ‘process.’ It’s just … how we work.”

Andrea leaned forward. “This is actually really important. You’re debating whether to implement sophisticated shop-floor tracking, but you’re missing the fact that you already have a shop-floor information system—it’s just not digital. It’s Otto’s experience and judgment about what to communicate to Sarah.”
The Information Flow
Patrick pulled up Business Central on his laptop. “Let me make sure I understand the current situation. In Business Central, we create production orders and release them. But until someone posts output when the entire order is complete, the system shows no progress. It doesn’t know if we’ve started the order, how far along we are, or if we’re running late.”
“Correct,” Sarah confirmed.
“But you know more than Business Central knows,” Patrick said. “When I look at your whiteboard, I see notes about delays, status updates, and jobs that started but aren’t finished. Where does that information come from?”
“From Otto,” Sarah said simply. “And from walking the shop floor myself. And from supervisors stopping by my office.”
Klaus was taking notes. “So, we have two information systems running in parallel. Business Central is the official record—it tracks when production orders are created and when they’re reported complete. But Sarah’s whiteboard is the operational reality—it tracks what’s actually happening day-to-day, even though that information never makes it into Business Central.”
“That’s why the whiteboard has been so hard to replace,” Emma observed. “It’s not just a scheduling tool. It’s Sarah’s way of capturing operational reality that our digital systems don’t see.”
Stefan nodded vigorously. “This is exactly what I was hoping we’d uncover. When you implement scheduling software, you’re not just replacing the whiteboard. You’re replacing an entire informal information system. And if we don’t replicate that information flow in the new system, the schedule will be just as disconnected from reality as Business Central currently is.”
The Communication Protocol
Sarah felt something clicking into place. “So even without operation-level posting, we need a way for shop floor reality to update the schedule. Not automatically, not in real-time, but at least when significant things happen.”
“Exactly,” Andrea said. “And the good news is, you already have that system with Otto. We just need to make it explicit and adapt it to work with scheduling software instead of the whiteboard.”
Otto looked skeptical. “You want me to update the scheduling software every time something changes?”
“Not every time,” Stefan said. “But when you currently call Sarah or stop by her office—those same triggers should cause schedule updates in the software.”
“Can we define that?” Emma asked. “What are the triggers that require communication from the shop floor to scheduling?”
Sarah grabbed a marker and walked to the whiteboard. “Let me think about what Otto typically tells me.” She started writing:
Current Communication Triggers:
- Job supposed to start this morning, hasn’t started by midday
- Operation taking longer than expected => will finish late
- Machine breakdown affecting scheduled work
- Quality issue requiring rework
- Material shortage => delaying the start
- Urgent customer change requiring reprioritization
Otto studied the list. “That’s pretty much it. Those are the things I make sure Sarah knows about.”
“And when you tell Sarah these things, what do you do, Sarah?” Klaus asked.
“I update the whiteboard,” Sarah said. “I move the magnetic strips to reflect the new reality. Sometimes I have to rejuggle other jobs to accommodate the changes.”
Stefan was typing notes rapidly. “This is the bridge we need to build. When these triggers occur, instead of Otto calling Sarah, who updates the whiteboard, Otto calls Sarah, who updates the schedule in the software.”
“That sounds like the same amount of work,” Otto observed.
“It is,” Andrea admitted. “Phase one won’t reduce the communication burden. But it will make that communication more structured and ensure the scheduling system reflects reality, not just the plan.”
Defining “Major Deviation”
Klaus looked at the list Sarah had written. “These triggers are pretty general. ‘Taking longer than expected’—how much longer? ‘Job hasn’t started by midday’—why midday specifically? We need to be more precise.”
“You’re right,” Sarah said. “With the whiteboard, I’ve been making judgment calls. If something is running a couple of hours late, I might not adjust immediately. But if it’s going to miss the day, I need to know.”
She turned to Otto. “What’s realistic for you to track and communicate? I don’t want to burden you with constant updates, but I need to know about significant deviations.”
Otto thought carefully. “Here’s what I can commit to. If a production order was scheduled to start on a specific day and we haven’t started it by the end of that day, I’ll let you know. That’s clear-cut—either we started it, or we didn’t.”
“What about operations in progress?” Sarah asked.
“If an operation was expected to finish on a specific day according to the routing sheet, and it’s not going to finish that day, I’ll let you know by mid-afternoon so you can adjust.” Otto paused. “But I need the routing sheets to show clear expected dates. Right now, they just show operation sequences.”
Patrick nodded. “The scheduling software can print routing sheets with scheduled dates for each operation. That gives Otto a clear target to measure against.”
Sarah was writing new criteria on the whiteboard:
Agreed Communication Rules for Phase One:
- Production Order Start Deviation: Otto informs Sarah if a production order scheduled to start on Day X has not started by the end of Day X
- Operation Completion Deviation: Otto informs Sarah by 2 PM if an operation scheduled to complete on Day X will not complete by the end of Day X
- Equipment Failure: Otto informs Sarah immediately if a machine breakdown affects jobs scheduled for the next 48 hours
- Material Shortage: Otto informs Sarah as soon as he discovers materials aren’t available for scheduled work
- Quality Issues: Otto informs Sarah if quality problems require rework that will delay completion by more than one day
- Customer Changes: Sales/Klaus inform Sarah immediately of any customer request affecting delivery dates within the next two weeks
“This is more specific than our current process,” Otto said, studying the list. “Right now, I just use my judgment about what’s important enough to tell you.”
“Which works because you have great judgment,” Sarah replied. “But we’re building a system that needs to work even when you’re on vacation or when we hire new supervisors. We need explicit rules.”
Emma looked at the list approvingly. “This is pragmatic. It doesn’t require constant updates on every operation, but it ensures that significant deviations are communicated and the schedule stays reasonably aligned with reality. For us, this adds significant value to our schedule, as many of our production orders run longer than one day. And the longer the runtime, the more important it is to get groundbreaking feedback.”
The Manual Update Process
Stefan pulled up the scheduling software interface. “Let me show you how this would work practically. Otto calls Sarah or stops by her office with an update. Sarah opens the scheduling software, finds the affected production order, and updates the status.”
He demonstrated on screen. “For example, Otto says, ‘Production order 4523 was supposed to start Monday, but we can’t start until Wednesday because materials are delayed.’ Sarah opens that order in the schedule, changes the start date to Wednesday, and regenerates the schedule. The software automatically adjusts downstream dependencies.”
“How long does that take?” Klaus asked.
“Fifteen seconds to a maximum of two minutes, depending on complexity,” Stefan replied. “Much faster than moving magnetic strips and recalculating impacts manually.”
“And the schedule update is saved immediately?” Patrick asked.
“Yes. Everyone who accesses the schedule sees the updated version. No risk of someone working from an outdated plan.”
Otto nodded slowly. “So, I’m still calling Sarah as I do now. She’s still updating the plan as she does now. The main difference is that the update happens in software instead of on the whiteboard.”
“Exactly,” Andrea confirmed. “Phase one doesn’t eliminate the manual communication. It makes that communication more structured and ensures the updates are visible to everyone who needs them.”
Sarah added a note to her criteria: “Phase One: Manual schedule updates based on shop floor communication. Phase Two (6 months): Shop floor tracking enables automatic schedule updates based on actual progress.”
“This makes sense to me,” Emma said. “We’re not trying to automate everything immediately. We’re taking our current informal process and making it more explicit and systematic. Then, after we’ve established that foundation, we add automation through shop floor tracking.”
Klaus looked at Otto. “Can you commit to these communication rules? They’re more structured than what you do now.”
“I can commit to them,” Otto said. “Actually, having clear triggers will make it easier. Right now, I sometimes wonder if something is important enough to interrupt Sarah. With these rules, it’s clear—if it meets the criteria, I communicate it. If it doesn’t, I don’t.”

The Bridge to Phase Two
Henning spoke up from the video screen. “What you’ve just defined is a beautiful bridge between your current state and your future state. Phase one acknowledges your current reality—manual communication, judgment-based updates—and makes it work with the new software. Phase two automates what you’re doing manually in phase one.”
He pulled up a diagram. “This is how successful implementations work. You don’t jump from chaos to perfection. You build intermediate steps that make sense, deliver value, and teach you what you need for the next step.”
Andrea added, “And here’s something important: after six months of phase one, you’ll have perfect clarity about what shop floor data actually matters. You’ll know which deviations happen frequently, which updates take the most time, and where automation would help most. Your phase two implementation will be much more focused because you’ll have real experience.”
Patrick was making notes. “This also means our phase two planning should include analysis of the phase one communication patterns. How many manual updates per day? Which types of updates are most common? That tells us where to focus the shop floor tracking investment.”
“I like this approach,” Emma said decisively. “It’s realistic about our current capabilities while creating a clear path to better capabilities. We’re not pretending we can jump to full automation overnight.”
The Interim Metrics
Sarah had been thinking while they discussed the communication protocols. Now she pulled the conversation back to the broader measurement question by opening a blank spreadsheet on her laptop. “Okay. Now that we are aligned on phases 1 and 2, let us return to the question of how we can measure the success of our scheduling implementation. Let’s define what we can measure with our current data capabilities. What matters most for knowing if scheduling is working?”
Klaus thought about this. “Schedule adherence—are we following the schedule we created? If we schedule a job to run on Monday and it actually runs on Wednesday, that’s a problem.”
“How do we measure that with order-level posting?” Sarah asked.
We cannot measure this,” Patrick answered shaking his head. “When we continue to post once the production order is finished, we get that posting date as a kind of finish date in the capacity ledger entries. However, it will not tell us when we started to work on that order.”
“Acknowledged. What can we get out of the information that we have?” Emma prompted.
“Overall on-time delivery,” Otto said. “Percentage of complete orders shipped on promised dates. That’s what customers actually care about. Business Central already tracks promised shipment dates versus actual shipment dates.”
And Patrick added, “If we go for a different definition of ‘schedule adherence’, we could get a very pragmatic indicator. On the finished production order, we see the scheduled end date. And from the capacity ledger entries, we see the posting date, which in 95% of all cases is the date when the production was finished. I suggest we track what Otto just said and the pragmatic schedule adherence that I am suggesting. This way, we might get information if late shipments result from production or from all processes between production and shipment.”
Sarah was typing as people talked. “So, we have pragmatic schedule adherence at the order level and OTD performance. What about cost?”
“Overtime hours,” Klaus said. “We track overtime in our payroll system. If scheduling is working, we should need less emergency overtime because we’re planning better.”
“And expediting,” Otto added. “Count how many times we have to rush jobs or pay for expedited shipping because we missed our internal schedules. That’s directly related to scheduling effectiveness.”
“These aren’t perfect metrics,” Klaus acknowledged. “We’re not measuring operation-level performance or real-time WIP visibility.”
“But they’re measurable with what we have now,” Emma said. “And they directly connect to our business problems. Are we shipping orders on time? Are we reducing emergency costs?”
The Broader Perspective
Stefan had been taking notes throughout the discussion. “I suggest that we today also have a look at what will come after that interim phase. We have been talking about phases earlier, and I would like us to develop a joint understanding of how your metrics will look after the current start phase.”
He pulled up a timeline. “Phase one—first six months—you use the interim metrics Sarah just defined. Focus entirely on getting scheduling working, establishing usage patterns, and building organizational confidence. Measure what you can measure.”
“Phase two—months six through twelve—you implement pragmatic shop floor tracking. Not necessarily full operation-level reporting at every workstation, but enough data collection to give you visibility of where jobs are and whether operations meet their scheduled times. You achieve this through the staged implementation of shop-floor tracking software. You can, for example, start in machining. Get the first figures rolling in and have your operators become familiar with the software. Once established in one area of your shop, you roll it out into the next area.”
“Phase three—beyond month twelve—you build comprehensive manufacturing operations analytics. With six months of shop floor data, you can create PowerBI dashboards showing operation-level performance, resource utilization, actual versus planned times, and continuous improvement opportunities.”
“That’s a long timeline,” Klaus observed.
“It’s a realistic timeline,” Henning countered. “Rome wasn’t built in a day. Your manufacturing operations transformation won’t be either.”
Andrea added, “And consider what you’re building. Phase one gives you better scheduling than you have today. Phase two gives you shop floor visibility you’ve never had. Phase three gives you analytics that most manufacturers of your size don’t have. Each phase delivers value while building a foundation for the next phase.”
Emma looked around the table. “I’m comfortable with this phased approach. The interim metrics aren’t perfect, but perfection is the enemy of progress. We’ll measure what we can measure now and commit to building better measurement infrastructure once scheduling is stable.”
“Patrick,” she continued, “I want you to start planning for phase two now. Not implementing—planning. What shop-floor tracking would look like, what equipment we’d need, and what data we’d collect. So, when we’re ready to move forward in six months, we’re not starting from scratch.”
“I can do that,” Patrick said.
The Future Value
Klaus was still processing the phased approach. “Emma, can I push back on something? You talk about ‘good enough’ interim metrics, but these measurements will drive our decisions. If the metrics are inadequate, our decisions will be inadequate.”
“Fair point,” Emma acknowledged. “But consider the alternative. We are trying to implement comprehensive measurements now, alongside scheduling software, alongside shop floor data collection. What happens to our schedule adherence metric if operators are frustrated by data entry requirements and stop using the system correctly?”
She stood and walked to the whiteboard. “The interim metrics aren’t perfect, but they’re honest. We measure what we can actually measure reliably. And we commit—explicitly commit—to building better measurement infrastructure once we’ve established the foundation.”
Henning nodded approvingly. “Emma’s right. And there’s another benefit to the phased approach. When you implement shop floor tracking in six months, you’ll have six months of scheduling experience. You’ll know what information you actually need versus what sounds good in theory. Your phase two implementation will be more focused and practical because you’ll understand your real requirements.”
Sarah added, “Plus, the data we collect in phase two will be worth gold. Not just for looking back at what happened, but for improving forward. Actual operation times will help us fix our routing estimates. Real resource utilization will show us where our true bottlenecks are. Pattern analysis will reveal setup time variations we can address.”
“That’s exactly right,” Stefan confirmed. “The best master data improvement comes from actual production data. Companies that implement shop floor tracking see continuous improvement in their planning accuracy because reality keeps correcting their estimates.”
Otto had been quiet, but now he spoke. “Can I say something about the shop floor perspective? Right now, my team is skeptical about new software. They’ve seen changes before that made their jobs harder. If we implement scheduling and shop floor tracking together, they’ll associate both with each other. If either causes problems, they’ll resist both.”
He leaned forward. “But if we implement scheduling first, let them see it actually helps—better coordination, less chaos, fewer emergency changes—then they’ll trust us when we say ‘now we need to add data collection to make it even better.’ Sequence matters for change management.”
The Commitment
Emma looked at Stefan and Andrea. “Here’s what I want to happen. For this implementation, we focus entirely on getting scheduling operational using our current data infrastructure. We define success using the interim metrics Sarah outlined. We don’t scope-creep into shop floor tracking or comprehensive analytics.”
“Understood,” Stefan said.
“But,” Emma continued, “we document our phased roadmap explicitly. Six months post-implementation, we evaluate scheduling stability. If it’s working well, we proceed with shop floor tracking implementation. Twelve months post-implementation, we will build manufacturing operations analytics with the data we’ve collected.”
She looked at her team. “This isn’t lowering our ambitions. It’s acknowledging that sustainable transformation happens in phases, not overnight. We build foundation, then structure, then refinement.”
Sarah felt relief wash over her. They weren’t trying to solve everything simultaneously. They were being realistic about their organizational capacity while committing to long-term improvement.
“I’ll document this,” Sarah said, pulling up her laptop. “Phase one success criteria with interim metrics. Phase two commitment for shop floor tracking. Phase three vision for manufacturing operations analytics. We make this explicit so future-us doesn’t forget what current-us decided.”

Klaus nodded slowly. “I’m on board. Though I want to be clear—in six months, we’re implementing shop floor tracking. This isn’t indefinitely deferring better measurement. It’s strategically sequencing it.”
“Agreed,” Emma said. “Patrick, that planning work I mentioned? Make it concrete. What tablets or terminals would we need? What data collection process makes sense? What integration with Business Central is required? I want that ready to execute when we hit the six-month mark.”
The Metrics Dashboard
Sarah spent the next hour creating what she called the “Interim Scheduling Success Dashboard”—a simple spreadsheet that would track their key metrics weekly:
- Schedule Adherence Rate: Percentage of production orders completed within two days of the scheduled completion date
- On-Time Delivery Performance: Percentage of customer orders shipped on promised dates
- Overtime Hours: Total overtime hours per week across all departments
- Expedite Incidents: Number of times per week jobs need emergency prioritization
- Customer Complaints: Delivery-related complaints per month
- Throughput: Number of production orders finished per week
“These aren’t perfect,” she said, showing the spreadsheet to the team. “But they’re measurable, they’re tied to business outcomes, and they’ll show us if scheduling is working.”
Stefan reviewed the metrics. “This is actually pretty good for interim measurements. Most of our customers don’t define success criteria this clearly before implementation.”
“What’s our baseline?” Klaus asked. “We need to know where we’re starting to measure improvement.”
“I’ll calculate baselines from the past three months,” Sarah said. “That gives us pre-implementation benchmarks to compare against.”
She pulled up historical data and started filling in baseline numbers:
- Schedule Adherence: 58% (orders finishing within two days of plan)
- OTD Performance: 72% (orders shipping on promised dates)
- Overtime Hours: 127 hours/week average
- Expedite Incidents: 18/week average
- Customer Complaints: 4.3/month average
- Throughput: 68 production orders finished per week on average
“Those are sobering numbers,” Klaus said, looking at the baselines.
“They’re honest numbers,” Emma replied. “And they show us how much room we have for improvement. If we implement scheduling software and these numbers don’t improve significantly, we’ll know we have a problem.”
“What’s our target?” Otto asked.
Sarah thought about reasonable improvement goals. “Let’s say six months post-implementation: Schedule adherence to 85%, OTD to 90%, overtime reduced by 40%, expedites reduced by 60%, complaints down by half, and throughput 20% up without investing in new machines or hiring new people.”
“Ambitious,” Klaus noted.
“But achievable if scheduling actually works,” Sarah countered. “These targets basically say: we follow our plans most of the time, ship most orders when promised, handle most work in normal hours, rarely need emergency changes.”
Emma nodded. “Those targets feel right. Aggressive enough to matter, conservative enough to be realistic. Stefan, does this align with what you’ve seen other customers achieve?”
“It does,” Stefan confirmed. “Actually, your targets are more conservative than what our average customer achieves. I think you’ll exceed them if implementation goes well.”
The Evening Conversation
That evening, Sarah arrived home to find Tom working on a science project about measurement and observation.
“How do you measure things you can’t see?” Tom asked, looking up from his worksheet.
Sarah smiled at the timing. “That’s exactly what we were talking about at work today. What’s your answer?”
“My teacher says you measure the effects instead of the thing itself,” Tom explained. “Like, you can’t see wind, but you can measure how fast trees bend or how far things blow.”
“That’s perfect,” Sarah said. “That’s what we’re doing at work. We can’t see everything happening in production minute-by-minute, but we can measure the effects—whether orders finish on time, whether we ship when promised, whether we’re working crazy overtime.”
“Are those good measurements?” Tom asked.
“They’re good enough measurements for now,” Sarah replied. “Later, we’ll build better measurement capabilities. But good enough lets us get started instead of waiting for perfect.”
Miguel appeared with dinner. “So, you made progress today?”
“We defined what success looks like,” Sarah said. “Not perfectly, but realistically. Sometimes that’s the hardest part—figuring out what you’re actually trying to achieve.”
She pulled out her phone and showed Miguel the interim metrics dashboard. “These are the numbers we’ll track. They’re not everything we’d eventually like to measure, but they’re what we can measure now while we’re building the foundation.”
“And in six months?” Miguel asked.
“In six months, we implement shop floor tracking so we can measure more precisely,” Sarah replied. “But only if the foundation is working. One thing at a time.”
Tom looked at his parents. “Like learning addition before learning multiplication?”
“Exactly like that,” Sarah said. “You have to master the basics before moving to advanced topics. Same principle in manufacturing.”
Sarah’s phone buzzed with a message from Emma: “Good work today. We kept focus and made pragmatic decisions. That’s organizational maturity showing.”
Sarah showed the message to Miguel. “Organizational maturity,” she said. “I like that phrase. It means we’re learning to make realistic decisions instead of ideal ones.”
“The ideal is the enemy of the good,” Miguel quoted.
“And the measurable good is better than the unmeasurable ideal,” Sarah added. “Tomorrow, we start the actual implementation work. But at least now we know what we’re aiming for and how we’ll know if we hit it.”
She looked at her interim dashboard one more time. The metrics weren’t perfect. The phased approach meant waiting months for comprehensive analytics. But they were moving forward with clear success criteria, realistic expectations, and a commitment to continuous improvement.
Sometimes, Sarah was learning, success wasn’t about having perfect measurements. It was about having good enough measurements to guide your progress while you built the capability for better ones. They were measuring what mattered with what they had, while building infrastructure for measuring everything that would eventually matter.
That was enough to move forward. And moving forward, learning was better than waiting for perfection.